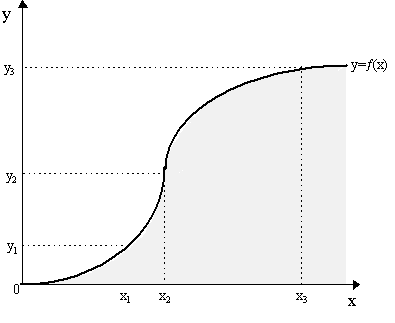
Contents (A) Understanding Returns to Scale (A) Understanding Returns to Scale (i) Classification Returns to scale are technical properties of the production function, y = ¦ (x1, x2, ..., xn). If we increase the quantity of all factors employed by the same (proportional) amount, output will increase. The question of interest is whether the resulting output will increase by the same proportion, more than proportionally, or less than proportionally. In other words, when we double all inputs, does output double, more than double or less than double? These three basic outcomes can be identified respectively as increasing returns to scale (doubling inputs more than doubles output), constant returns to scale (doubling inputs doubles output) and decreasing returns to scale (doubling inputs less than doubles output). The concept of returns to scale are as old as economics itself, although they remained anecdotal and were not carefully defined until perhaps Alfred Marshall (1890: Bk. IV, Chs. 9-13). Marshall used the concept of returns to scale to capture the idea that firms may alternatively face "economies of scale" (i.e. advantages to size) or "diseconomies of scale" (i.e. disadvantages to size). Marshall's presented an assortment of rationales for why firms may face changing returns to scale and the rationales he offered up were sometimes technical (and thus applicable in general), sometimes due to changing prices (thus only applicable to situations of imperfect competition). As we are focusing on technical aspects of production, we shall postpone the latter for our discussion of the Marshallian firm. The definition of the concept of returns in to scale in a technological sense was further discussed and clarified by Knut Wicksell (1900, 1901, 1902), P.H. Wicksteed (1910), Piero Sraffa (1926), Austin Robinson (1932) and John Hicks (1932, 1936). Although any particular production function can exhibit increasing, constant or diminishing returns throughout, it used to be a common proposition that a single production function would have different returns to scale at different levels of output (a proposition that can be traced back at least to Knut Wicksell (1901, 1902)). Specifically, it was natural to assume that when a firm is producing at a very small scale, it often faces increasing returns because by increasing its size, it can make more efficient use of resources by division of labor and specialization of skills. However, if a firm is already producing at a very large scale, it will face decreasing returns because it is already quite unwieldy for the entrepreneur to manage properly, thus any increase in size will probably make his job even more complicated. The movement from increasing returns to scale to decreasing returns to scale as output increases is referred to by Frisch (1965: p.120) as the ultra-passum law of production. We can conceive of different returns to scale diagramatically in the simplest case of a one-input/one-output production function y = ¦ (x) as in Figure 3.1 (note: this is not a total product curve!). As all our inputs (in this case, the only input, x) increase, output (y) increases, but at different rates. At low levels of output (around y1), the production function y = ¦ (x) is convex, thus it exhibits increasing returns to scale (doubling inputs more than doubles output). At high levels of output (around y3), the production function y = ¦ (x) is concave, thus it exhibits decreasing returns to scale (doubling inputs less than doubles output). [Note: the relationship between convexity and concave production functions and returns to scale can be violated unless the ¦ (0) = 0 assumption is imposed. Heuristically, a function exhibits decreasing returns if every ray from the origin cuts the graph of the production function from below. A production function which is strictly concave but intersects the horizontal axis at a positive level (thus ¦ (0) < 0) will not exhibit decreasing returns to scale. Similarly, a non-concave production function which intersects the vertical axis at a postitive amount (thus ¦ (0) > 0) will exhibit decreasing returns to scale.]
(ii) Justification The economic justification for these different returns to scale turns out to be far from simple. At the most naive level, we justify increasing returns to scale by appealing to some "division of labor" argument. A single man and a single machine may be able to produce a handful of cars a year, but we will have to have a very amply skilled worker and very flexible machine, able to singlehandedly build every component of a car. Now, as Adam Smith (1776) famously documented, if we add more labor and more machines, each laborer and machine can specialize in a particular sub-task in the car production process, doing so with greater precision in less time so that more cars get built per year than before. The ability to divide tasks, of course, is not available to the single man and single machine. Specialization reflects, then, the advantage of large scale production over small scale. In Figure 3.1, assume we increase all factor inputs from x1 to x2, reflecting, say, the movement from a single man-and-machine to fifteen men-with-machines. The total output increases, of course, but so does the productivity of each man-and-machine since fifteen men-and-machines can divide tasks and specialize. So increasing factors fifteen-fold, increases output more than fifteenfold. In effect, we have increasing returns to scale. We should note that by justifying increasing returns by specialization implies that increasing returns is necessarily associated with a change of method. But this implies there are indivisibilities in production. In other words, the specialized tasks available at large scale are not available at the smaller scale; consequently, as the scale of production increases, these indivisibilities are overcome and thus methods not previously available become available. (K. Wicksell, 1900, 1901; F.Y. Edgeworth, 1911; N. Kaldor, 1934; A.P. Lerner, 1944; cf. E.H. Chamberlin, 1948). Nonetheless, we should note that there are direct examples of pure increasing returns to scale. For instance, consider a cylinder such as an oil pipeline and the mathematical relationship between the steel it contains (= 2p rl where r is the radius and l the length of the pipe) and the volume of oil it can carry (= p r2l). If one adds sufficient steel to the cylinder to double its circumference, one will be more than doubling its volume. Thus, doubling inputs (steel in pipeline) more than doubles output (flow of oil). In this example, increasing returns does not involve changes in technique. However, these pure examples are rare and the rationale for increasing returns is usually given by specialization. Thus, we can say equivalently that increasing scale captures the idea that there is technical progress with increasing scale. This is how we find it explicitly expressed in the work of Allyn A. Young (1928) and Nicholas Kaldor (1966) and, indeed, modern Neoclassical endogenous growth theory. As such, as it is generally discussed, increasing returns is more than a "pure scale" matter; it is about emerging techniques and changes in technique, of which we shall have more to say later. Decreasing returns to scale are more difficult to justify. We see that, in Figure 3.1, moving from x2 to x3, the production function is concave, so that by doubling inputs we less than double output. The naive justification is that the size of production has overstretched itself. The advantages of specialization are being outweighed by the disadvantages of, say, managerial coordination of an enterprise of such great scale. However often employed (e.g. Marshall, 1890: Ch. 12; Hicks, 1939: p.83; Kaldor, 1934), this "managerial breakdown" explanation is not really legimitate. This is because "returns to scale" requires that we double all inputs, yet we have not increased one of the factors: namely, the managers themselves. In the managerial breakdown argument, the manager implicitly remains as a "fixed factor", thus we are no longer talking of "decreasing returns to scale" in its pure technical sense but rather of diminishing marginal productivity, which is quite a different concept. In principle, then, decreasing returns to scale is hard to justify technically because every element in production can always be identically replicated (i.e. all inputs increase). To take another common but misleading example, suppose we increase the number of fishing boats in the North Sea. In this case, we would expect each boat to catch relatively less fish. Similarly, taking Pareto's (1896, II: 714) example, doubling the number of train lines from Paris will lead us to expect that each train will carry less passengers. But these examples are not examples of decreasing returns to scale be cause we have not, appropriately speaking, doubled all inputs: we have kept the North Sea and Paris constant. In other words, we have changed factor proportions: we have more fishing boats per square mile of North Sea and more trains per Parisian passenger. The accurate exercise for decreasing returns to scale in the first case is to double the number of boats and double the size of the North Sea (and thus double the number of fish). Similarly, we would need to double the number of trains and double the number of Parisians. In other words, one needs to replicate the North Sea and Paris completely, is entirely possible. The only way one might obtain decreasing returns to scale in these circumstances is if there were externalities of some sort, e.g. the existence of second replica implicates the operation of the first ("there is only one Paris...", etc.). Yet, barring this, two identical North Seas or two identical cities of Paris should not interfere with each other. Thus, decreasing returns simply do not make technical sense since replication does not complicate things. Another reason for doubting the existence of decreasing returns to scale is more empirical. Specifically, it would not be "rational" for an enterprise to ever produce in such a situation. To see this, suppose there is an entrepreneur who has a given set of laborers and machines willing to work for him. He can either put all these factors into a single factory, or just construct a series of smaller, but identical factories. Obviously, if he is facing decreasing returns to scale, then organizing them into several, decentralized, separate factoriesis better than throwing them all together into a single, centralized factory. Consequently, one of the justifications sometimes found for arguing for decreasing returns to scale is that production faces indivisibilities so that "dividing" a factory into several factories is simply not possible. Technically speaking, then, only constant and increasing returns can make sense; decreasing returns are harder to accept. The asymmetric nature of different returns to scale was explicitly admitted by Alfred Marshall in a footnote, "the forces which make for Increasing Return are not of the same order as those that make for Diminishing Return: and there are undoubtedly cases in which it is better to emphasize this difference by describing causes rather than results." (Marshall, 1890: p.266, fn.1). However, the problematic nature of this asymmetry of causes for a competitive economy, as we shall discuss later, were fully uncovered by Piero Sraffa (1925, 1926). It will be noticed that although most textbooks since have continued to refer to the possibility of decreasing returns to scale, they also often add parenthetically that they are assuming a fixed factor, or indivisibilities or some other imperfection that violates somewhat its pure definition. Be that as it may, it is important to note that decreasing returns to scale, in its proper symmetric definition, is rarely held among modern economists. In contrast, increasing returns, as noted, have become irretrievably associated with technical progress. (iii) Characterization We can characterize the "returns to scale" properties of a production function via the homogeneity properties of the production function. In principle, consider a general function:
Now, a function of this type is called homogeneous of degree r if by multiplying all arguments by a constant scalar l , we increase the value of the function by a r, i.e.
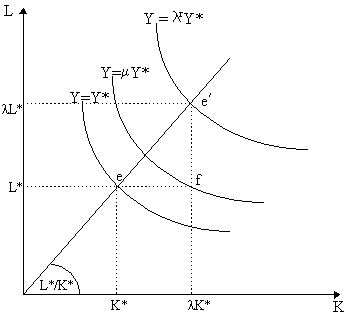
If r = 1, we call this a linearly homogenous function. Now, if we interpret this function to be a production function, then the implications are obvious. If r = 1, then l r = l , so increasing inputs by factor l will increase output by the same factor l . This, of course, is the very definition of constant returns to scale. If r > 1, then l r > l , which implies that when we increase inputs by scalar l , output will increase by more than proportionally. This is the definition of increasing returns to scale. Finally, if 0 < r < 1, then l r < l , which implies that increasing inputs by a scalar l will lead output to increase by less than proportionally. This is the definition of decreasing returns to scale. We can gain a clearer understanding of returns to scale by examining diagramatically via isoquants as in Figure 3.2 - thus we must assume a two-input, one-output production function, Y = ¦ (L, K). Consider a factor configuration denoted by (K*, L*), which yields output Y =Y*, as noted by point e in Figure 3.2. If we increase both capital and labor by the factor l , then notice that we obtain a new factor configuration (l K*, l L*) which yields output Y = lrY*, as noted by point e¢ in Figure 3.2. This "increasing scale" is represented by a movement along the ray from the origin with slope L*/K*..
Consequently, whether we have increasing, constant or decreasing returns to scale depends upon r, the degree of homogeneity. It is simply a matter of labelling our isoquants appropriately. If r = 1, then l rY* = l Y* = ¦ (l K*, l L*), thus we have constant returns. If r > 1, then l rY* > l Y*, so we have increasing returns. If r < 1, then l rY* < l Y*, so we have decreasing returns to scale. Diagramatically, the idea of different returns to scale is thus captured by the degree to which isoquants are spaced from each other as we move along the ray from the origin. If they are equally spaced along the ray, then we have constant returns to scale. If the isoquants are rather spread out at low levels of output and then begin to cluster together as scale increases, then we have increasing returns to scale. In contrast, if they begin rather clustered together and then spread out more sparsely as scale increases, then we have diminishing returns. In order to capture the pure returns to scale effect, we can employ W.E. Johnson's (1913) elasticity of production, rebaptized by Ragnar Frisch (1965: p.65) as the passus coefficient, but which may be more appropriately referred to simply as the elasticity of scale. This is defined as follows:
Thus, the elasticity of scale e measures the responsiveness of output to an increase in all inputs by the scalar factor l , normalized here to 1. As we know, under constant returns to scale, ¦ (l x) = l ¦ (x). Thus, ¶ ¦ (l x)/¶ l = ¦ (x) and l /¦ (l x) = 1/¦ (x), so e = 1, we have unit elasticity of scale. If we have decreasing returns to scale, then by analogous reasoning, e < 1, while for increasing returns to scale, e > 1. Intuitively, when e < 1, then output increases "less rapidly" than inputs, while if e > 1, then output increases "more rapidly" than inputs, whereas when e = 1, inputs and outputs increase "at the same rate" (thus what Frisch (1965: p.99) calls a pari-passu law is merely a constant returns to scale production function). One of the interesting results of the elasticity of scale is that e is actually the sum of the output elasticities of the different inputs. Let e i denote the elasticity of output with respect to factor xi, i.e.
thus the elasticity of output with respect to input xi is the ratio of the marginal product of xi to the average product of xi. We assert, then, that:
the elasticity of scale is the sum of the output elasticities with respect to factor inputs. To obtain this result, note that as e = (¶ ¦ (l x)/¶ l )·l /¦ (l x) evaluated at l = 1. Now, in general, ¦ (l x) = ¦ (l x1, l x2, .., l xm). Thus, differentiating with respect to l , ¶ ¦ (l x)/¶ l = ¦ 1·x1 + ¦ 2x2 + ... + ¦ m·xm, where ¦ i = ¶ ¦ (l x)/¶ xi. Thus:
Evaluating at l = 1, then:
where, notice, ¦ i is the straight marginal product of factor i. Now, to obtain the elasticity of scale, we need to multiply the above by l /¦ (l x), i.e.
again, evaluating at l = 1:
or:
which is exactly what we wanted to obtain. The relationship between the elasticity of scale and the output elasticities tell us that, indeed, there is a relationship between returns to scale and marginal productivities. However, it is important not to get confused between the two and assume that, say, diminishing marginal productivity is somewhow related to decreasing returns to scale. This is not true. Constant returns or increasing returns to scale are compatible with diminishing marginal productivity. For instance, examine Figure 3.2 again. Let r = 1 everywhere, so that we have constant returns, thus l rY* = l Y. Now, if we increase capital only by the scalar l and leave labor unchanged, we obtain a new configuration (l K*, L*) at point f in Figure 3.2. Notice that we now achieve a level of output Y = m Y* = ¦ (l K*, L*) which is lower than Y = l Y* = ¦ (l K*, l L*), thus implying that m < l . Thus, increasing both capital and labor by the amount l leads to an increase in output by l . But increasing capital employment only by the amount l leads to an increase in output of merely m . We can see the (non-)relationship between returns to scale and marginal productivity more clearly if we take a specific functional form for the production function. Consider the famous Cobb-Douglas production function (Wicksell, 1901: p.128; Cobb and Douglas, 1928). This is the following:
where A, a and b are positive constants, and K and L are capital and labor respectively. Increasing both capital and labor by the scalar l , then we obtain:
so output increases by the factor la +b . If a + b = 1, then we have constant returns to scale. Decreasing returns to scale implies that a + b < 1 and increasing returns to scale implies that a + b > 1. Now, the marginal products of capital and labor are:
To see diminishing marginal productivity, we must show that marginal products decline as the relevant factors rise. Pursuing this, we see that:
Notice that for diminishing marginal productivity, ¦ KK < 0 and ¦ LL < 0, and this will be true if 0 < a < 1 and 0 < b < 1. However, this does not necessarily imply what kind of returns to scale we will obtain. Obviously, decreasing returns to scale fulfills this automatically (a + b < 1) and so does constant returns (a + b = 1). However, notice that some cases of increasing returns (a + b > 1) also satisfy this, e.g. a = 0.6 and b = 0.7. Thus, while diminishing marginal productivity may be implied by decreasing or constant returns to scale, it does not itself necessarily imply any particular kind of returns to scale. One final word may be in order. Recall that diminishing marginal productivity was guaranteed by the concavity of the production function. However, we only sought to make the assumption that the production function was quasi-concave but, as we saw, this was not enough to guarantee diminishing marginal productivity. However, it can be shown that under constant returns to scale, quasi-concavity does imply diminishing marginal productivity. To see this, consider the following. Let ¦ by homogeneous of degree 1 (constant returns to scale). Consider two input bundles x and x¢ . For the first bundle x, by constant returns to scale, l ¦ (x) = ¦ (l x). Letting l = 1/¦ (x), we obtain 1 = ¦ (x/¦ (x)). Once again, by constant returns to scale, we see that l = ¦ (l x/¦ (x)). Doing the same for the second bundle x¢ , we obtain the result that:
Now, quasi-concavity of ¦ implies that
for any a Î (0, 1). In fact, let us define a = ¦ (x)/(¦ (x) + ¦ (x¢ )), so (1-a ) = ¦ (x¢ )/(¦ (x)+¦ (x¢ )). As a result, we can rewrite this as:
or simply:
by constant returns to scale, we can remove the term l /[¦ (x)+¦ (x¢ )] from the argument:
so cross-multiplying:
As this is true for any input bundles x and x¢ , then it will also be true for l x and (1-l )x¢ , where l Î (0, 1). Thus substituting:
Finally, by constant returns to scale once again, the terms on the right hand side can be rewritten as follows:
which effectively states that the function ¦ is concave. Thus, quasi-concavity combined with constant returns to scale yields concavity. We know from before that concavity is sufficient for diminishing marginal productivity. Thus, in the presence of constant returns to scale, quasi-concavity actually implies diminishing marginal productivity. One of the interesting implications of the different returns to scale is obtained via Euler's Theorem on homogenous functions. Specifically, Euler's Theorem states that if y = ¦ (x1, x2, .., xn) is homogeneous of degree r, then the sum of arguments (inputs, x1, x2, .., xm) multiplied by their partial derivatives (¦ i = ¶y/¶ xi) will yield the output y multiplied by a scalar r, i.e.
where r is the "degree of homogeneity". Interepreting this as a production function, then notice that constant returns to scale (r = 1) implies that:
whereas increasing returns to scale (r > 1) implies that:
and decreasing returns to scale (r < 1) implies that:
These properties will be very useful later when considering the marginal productivity theory of distribution. For the moment, it is worthwhile noting one interesting property of constant returns to scale that is obtained via Euler's Theorem. Recall that by definition, if Y = ¦ (L, K) exhibits constant returns to scale, then we can express output as:
so dividing through by L:
or:
so the average product of labor (APL) is equal to the sum of the marginal productivity of capital (MPK) multiplied by the capital-labor ratio (K/L) and the marginal productivity of labor (MPL). Rearranging:
which is a useful relationship. Notice that L/K is positive. Thus, in order for MPK be positive, it is necessary that APL > MPL. If APL < MPL, we end up with the result that MPK is negative. Now, earlier on we showed that the average product of labor is higher than marginal product only when there is diminishing marginal productivity of labor. If there is increasing marginal productivity of labor, then APL < MPL. However, by the relationship outlined above, if the latter is true, then the marginal product of capital is negative, MPK < 0. By our discussion of the ridge lines of the isoquant topography, we know that negative marginal products are ruled out as irrelevant. Consequently, we see that in the special case of constant returns to scale, when we rule out negative marginal productivity of capital, we are simultaneously ruling out increasing marginal productivity of labor. In terms of our earlier Figure 2.3, we are only allowing points between L3 and L5. We can do this exercise in reverse and show that ruling out negative marginal productivity of labor is equivalent to ruling out increasing marginal productivity of capital. Thus, the conclusion that imposes itself is that when we are using constant returns to scale production functions of two inputs, ruling out negative marginal products is equivalent to imposing diminishing marginal productivity on all factors. At any rate, to avoid worrying about ridge lines, it is common in economic applications to impose the "Inada conditions" on production functions such as Y = ¦ (K, L). Effectively, these conditions (from Inada, 1964) are the following limiting conditions:
In other words, (i) states that the marginal product of a factor approaches zero as the amount of the factor approaches infinity and that the marginal product approaches infinity and that amount of that factor approaches zero. These conditions are ssufficient to guarantee that for all finite amounts of factors used, the marginal products are positive and diminishing, i.e. "well-behaved". It is noticeable that Cobb-Douglas production functions fulfill the Inada conditions automatically. (C) Homogeneity and Homotheticity Properly speaking, "pure scale" effects should always be considered along a ray from the origin. Increasing and decreasing returns should, in its purest definition, be a mere relabelling of the isoquants or, if we wish, a change in the spacing between the isoquants. However, the economic justification of increasing and decreasing returns to scale often relies on changing factor proportions as scale changes. The murkiness that often acompanies the justification of increasing or decreasing returns thus stems in good part from an imperfect definition of returns to scale in the work of the early Neoclassicals. Two of the major properties of constant returns to scale production functions is that both the average productivities and the marginal productivities of factors are independent of the scale of production, i.e. they depend on factor proportions only. To see this, consider the simple two-input, one-output production function, Y = ¦ (K, L). By assumption, under constant returns, l ¦ (K, L) = ¦ (l K, l L) for any l > 0. Letting l = 1/L, this can be restated as:
where the term on the left, of course, is merely the average product of labor, APL. A similar exercise establishes that APK = ¦ (K, L)/K = ¦ (1, L/K). Thus, average products of either factor depends only on the capital-labor ratio, L/K and not on the input levels, thus they do not depend on scale. Let us turn to marginal products. By constant returns to scale, l ¦ (K, L) = ¦ (l K, l L). Differentiating with respect to one of the inputs, say K:
or as ¶ l K/¶ K = l , then this reduces to:
thus letting l = 1/L, we obtain:
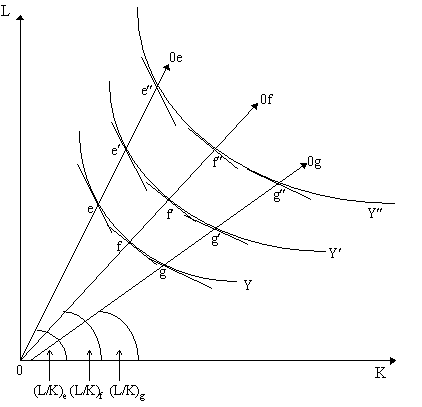
in other words, the marginal product of capital depends only on the capital-labor ratio, K/L. A similar exercise achieves the same result for the marginal product of labor. Consequently, as the marginal rate of technical substitution (MRTS) is simply the ratio of marginal products, then it follows that the MRTS is unaffected by scale. This result follows from the basic fact that if y = ¦ (x) is a homogeneous function of degree r, then the first derivatives, ¦ i(x), are homogeneous functions of degree r-1. Thus, for the constant returns to scale case, as y = ¦ (x) is homogeneous of degree 1, then ¦ i(x) is homogeneous of degree zero, i.e. a proportional increase in inputs will not change marginal products at all. We can see the implication for increasing or decreasing returns. For instance, if y = ¦ (x) is homogeneous of degree 2 (increasing returns to scale), then the marginal product ¦ i(x) is homogeneous of degree 1 (i.e. an increase in scale by l will increase marginal products by l ). In contrast, if y = ¦ (x) is homogeneous of degree 1/2 (decreasing returns to scale), then ¦ i(x) is homogeneous of degree -1/2 (i.e. an increase in scale by l will decrease marginal products by factor Ö l ). In sum, under constant returns, increasing scale does not affect marginal products; under increasing returns, an increase in scale increases all marginal products and under decreasing returns, an increase in scale decreases all marginal products. However, it is important to note, that a change in scale under any returns to scale, will not affect the marginal rate of technical substitution (MRTS). This is true under increasing, decreasing or, as we saw, constant returns. This is because all marginal products change by the same proportion. As we saw, under any type of returns to scale, increasing the scale of production by l will increase marginal product of capital from ¦ K to l r-1¦ K and marginal product of labor from ¦ L to l r-1¦ L, where r is the degree of homogeneity of the original production function. But the ratio of marginal products is still the same as ¦ K/¦ L = l r-1¦ K/l r-1¦ L. Thus, along any expansion ray from the origin, the MRTS is the same for every isoquant, whether we have increasing, decreasing or constant returns. This is shown heuristically for the two-input, one-output case, Y = ¦ (K, L) in Figure 3.3 (imperfectly drawn). Any ray from the origin, or "factor beam", reflects a particular labor-capital ratio, L/K. Increasing the scale of production always means an expansion along one of these rays. Notice that if we begin at a point such as e, increasing scale moves to points along the 0e ray, such as e¢ and e¢ ¢ . Notice that the slopes of the isoquants at e¢ and e¢ ¢ is the same as the slope of the isoquant at e. Similarly, increasing scale from f, we will achieve points such as f¢ and f¢ ¢ - and at these points, the slope of the isoquant is the same as it was at f. The constancy of isoquant slopes along any expansion ray is the meaning of our statement that the marginal rate of technical substitution is unaffected by scale.
Homogeneous functions (whatever the degree) are special cases of a more general class of functions known as homothetic functions (Shephard, 1953). A function F is homothetic if it is itself a monotonic transformation of a homogeneous function. Succinctly, suppose:
where ¦ (x) is a homogeneous function of degree r and g is any monotonic transformation (i.e. g¢ (x) ¹ 0). Then we say F(x) is a homothetic function. Note that F(x) is not itself necessarily homogeneous, but merely has to be a monotonic transformation of a homogeneous function. (for economic contexts, we usually restrict g to be an increasing monotonic transformation, i.e. g¢ (x) > 0). It is a general property of homothetic functions that they possess a constant slope for their own "isoquants" along any scale expansion ray. Indeed, it is a simple matter to demonstrate that the slope of the "isoquants" of the homothetic function F(x) are exactly the same as the slope of the isoquants of the original homogeneous function ¦ (x). Consider, for example, the production function Y = ¦ (K, L). Thus, F(K, L) = g[¦ (K, L)]. Consequently, the slope of the homothetic isoquant is:
thus the isoquant slopes are the same. By the same token, if the slope of the isoquant of ¦ is unchanged along an scale expansion ray, consequently, the slope of the isoquant of F is also unchanged along that ray. A final reflection must be made on the returns to scale. As noted, we are adopting a rather rigorous definition of "increasing scale", which involves necessarily the idea that we are increasing factors proportionally. This, as noted earlier, lands the traditional Neoclassical justifications for the concepts of increasing and decreasing returns in trouble, as they tend to rely on changing factor proportions as we increase size. Rigorously, anything other than constant returns to scale does not really make sense when we speak of "increasing scale" of a production process. Interestingly, Frisch (1965) defines the possibility of only two types of increases in output, what he calls the pari-passu law and the ultra passum law. The pari-passu law is simply the constant returns to scale case. However, Frisch still finds some degree of usefulness in the old idea that as output grows, production functions will exhibit increasing, constant and then decereasing returns to scale - which is what he defines as the ultra-passum law. However, he makes it clear that the ultra-passum law is not about "increasing scale" in the rigorous definition, but merely "increasing size" in an amorphous manner that allows for changing factor proportions and fixed factors along the way. Thus, Frisch (1965) carefully differentiates between a factor beam (i.e. a proper increase in scale with all factors increasing proportionally, which applies for the pari passum law) and a rising curve (a general increase in output size with possible changing factor proportions along the way, which applies for the ultra passum law). (D) The Intensive Production Function As we have seen, under constant returns to scale, marginal products are unchanged by scale. As a result, when dealing with simple two-input, one output production functions of the type Y = ¦ (K, L), it is often useful to work with the famous "intensive" or "ratio" or "per capita" representation of that production function. In other words, we can express the production function Y = ¦ (L, K) in per capita terms (i.e. per unit of labor) as y = f (k), where y = Y/L and k = K/L. Specifically, by constant returns to scale, we know that:
so letting l = 1/L, then
or defining y = Y/L as the output-labor ratio and k = K/L as the capital-labor ratio, then this can be translated to:
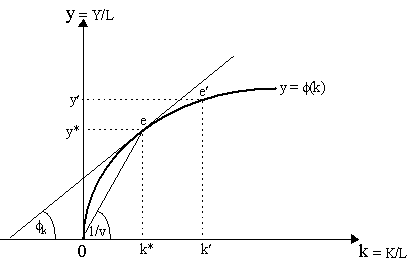
so that output per capita, y, is a function of capital per capita, k. We can express this more succinctly as y = f (k), which is commonly referred to as the "intensive production function". This is shown in Figure 3.4 below, originally due to Knut Wicksell (1893: p.122) and resurrected by Joan Robinson (1956: p.412) and Robert M. Solow (1956). A particular capital-labor ratio, k*, yields a particular output-labor ratio, y*. Increasing the capital-labor ratio to k¢ increases the output-labor ratio to y¢ .
The advantage of the intensive production function representation is that we can allow for both variations in capital and labor in a single, two-dimensional diagram. Dealing with ratios is useful in the constant returns to scale case because we know, as we saw before, that marginal products and average products are unaffected by the output level in the constant returns case and thus need not worry too much about scale effects. Consequently, intensive production functions offer a more compact form of analyzing production, particularly in theories where increasing scale is present but needs to be subsumed (e.g. Neoclassical growth theory). If we increase capital for a given level of labor or decrease labor for a given level of capital, in either case we are increasing the capital-labor ratio, k. We can see the impact of changing capital-labor ratios on both the output-labor ratio and the output-capital ratio directly in Figure 3.4. Specifically, note that y = Y/L is read off the production function directly. The output-capital ratio, Y/K is actually the slope of the ray from the origin to a point on the production function. In other words, letting K/Y = v, then output-capital ratio can be read as the slope 1/v of the ray from the origin to e. Thus, we can see that by increasing the capital-labor ratio from k* to k¢ , we increase the output-labor ratio from y to y¢ but we also decrease the output-capital ratio (1/v falls as the ray from the origin is becomes flatter). The concave "shape" of the intensive production function obtains because of diminishing marginal productivity to each of the factors. In fact, the slope of the intensive production function, f k, as represented by the angle q in the ray tangent to the point on the production function, is the marginal product of capital itself. To see this, recall that the marginal product of capital is defined as ¶ Y/¶ K = ¦ K. By definition, we know that Y/L = y, thus Y = Ly = Lf (k). Thus:
But as f (k) = ¦ (1, K/L), then ¶ (Lf (k))/¶ K = Lf k(¶ k/¶ K). As ¶ k/¶ K = 1/L, then:
thus the slope of the intesive production function (f k) is precisely the marginal product of capital. In Figure 3.4, this is precisely the angle q . Note that this replicates our earlier demonstration that under constant returns to scale, the marginal product of a factor depends only on the capital-labor ratio, k, and not on the scale of production. The marginal product of labor can be obtained directly by Euler's Theorem applied here. Specifically, by Euler's Theorem, as Y = ¦ (L, K) is a constant returns to scale production function, then:
thus in per capita terms:
so:
by our previous result that ¦ K = f k. This is the expression for the marginal product of labor in an intensive production function. We shall make use of this later in our theory of distribution. To take an example, consider once again a Cobb-Douglas production function, Y = AKa Lb. Under constant returns, a + b = 1, so this can be rewritten as Y = AKa L1-a . Now, dividing through by L, we obtain:
or, more simply:
which is the well-known intensive form of the Cobb-Douglas production function.
|

All rights reserved, Gonçalo L. Fonseca