Marshallian Stability |
 |
As Edgeworth reminds us, "Prof. Walras's laboured lessons indicate a way, not the way, of descent to equilibrium." (Edgeworth, 1889: p.435). Walras's tâtonnement process, which relies on the Law of Excess Demand, is by far the most popular way of describing stability of equilibrium, but there are many alternatives.
Perhaps the most famous alternative hypothesis is the dynamic process credited to Alfred Marshall (1890: Chs. 3, 5). In Marshall's process, quantities, rather than prices, are the adjusting variable. He sets this up by arguing that the quantity supplied responds to "excess profitability" in the market. It is a simple principle: the more profitable a particular good is, then more of it will be supplied because new producers will be attracted into that market; conversely, the less profitable it is, the more producers are bound to leave that market to go somewhere else (or go bankrupt) and thus supply of that good declines.
"Excess profitability" is defined a bit loosely in this context. In Neoclassical language, it has been argued to be the excess of price over marginal cost or the excess of price over average cost of production (it has been modeled both ways). The simplest way is to simply define it in Marshall's language as the excess of "demand price" over "supply price". Thus, letting p denote the demand price and c denote the supply price, then Marshall's "Law of Excess Profitability" is simply that quantity increases if p > c and the quantity decreases if p < c.
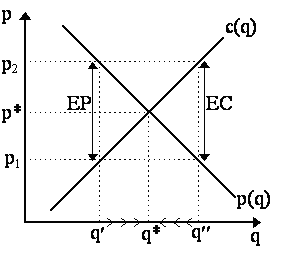
A word or two should be made about p and c. In Marshall's supply-and-demand model, both demand and supply prices are dependent variables, while quantities supplied are independent variables. In fact, the reason that the traditional "supply-and-demand" diagram has prices on the vertial axis and quantities on horizontal (confusing generations of students in principles classes!) is precisely because Marshall "inverted" Walras's supply-and-demand diagrams (which originally had price on the horizontal and quantity on the vertical axis). Thus, in Marshall, the demand curve is actually p = p(q) and the supply curve is actually c = c(q). This is how it is depicted in Figure 3.

- Marshallian adjustmentFig. 3
Marshall's adjustment process is easily described with reference to Figure 3. Formally, the Law of Excess Profitability is that:
dq/dt = ¦ [p(q) - c(q)]
where ¦ ¢ > 0, so if p(q) > c(q) ("excess profit"), then dq/dt > 0, whereas if p(q) < c(q) ("insufficient profit"/"excess cost"), then dq/dt < 0. The equilibrium quantity q* is defined where p(q) = c(q), i.e. there is zero excess profit. In terms of Figure 3, we begin at a quantity below the equilibrium quantity (e.g. q¢ ), then demand price is greater than supply price (as p(q¢ ) = p2 > p1 = c(q¢ )), so there is excess profit in that good, and thus the quantity produced will increase as other competing producers stream into the business. Thus, q¢ increases towards q*. In contrast, if we begin at quantity above equilibrium (e.g. q¢¢ ), then demand price falls below supply price (as p(q¢¢ ) = p1 < p2 = c(q¢¢ )), so there is insufficient profit, or excess cost. This will induce some firms to leave the business, thereby reducing quantity from q¢¢ towards q*. Marshall's own description could not be clearer:
"When therefore the amount produced (in a unit of time) is such that the demand price is greater than the supply price, then sellers receive more than is sufficient to make it worth their while to bring goods to market to that amount; and there is at work an active force tending to increase the amount brought forward on sale. On the other hand, when the amount produced is such that the demand price is less than the supply price, sellers receive less than is sufficient to make it worth their while to bring goods to market on that scale; so that those who were just on the margin of doubt as to whether to go on producing are decided not to do so, and there is an active force at work tending to diminish the amount brought forward for sale. When the demand price is equal to the supply price, the amount produced has no tendency either to be increased or to be diminished; it is in equilibrium." (Marshall, 1890: p.287)
Thus, we see that the Marshallian adjustment mechanism, while inherently different from the Walrasian, nonetheless also yields stability. However, the two systems are not identical. The details of the underlying dynamics are certainly different.
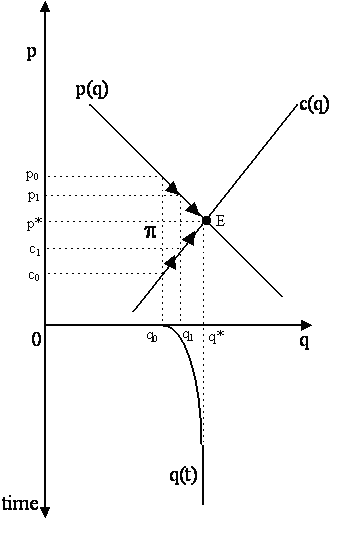
To see this, it is useful to examine the underlying dynamics of the Marshallian process. The market for apples is again depicted in the upper quadrant of Figure 4, the time path of the quantity of apples, q(t), is traced in the lower quadrant. At the initial quantity of apples, q0, there is excess profitability because the demand price for apples, p0, exceeds the supply price, c0. This will induce peach-growers to grow apples, thereby increasing the supply of apples from q0 to q1. As the quantity of apples produced rise, marginal costs rise from c0 to c1 (say, there is a greater demand for apple-pickers so their wages and thus costs to all apple farmers increase). Thus, we climb up the supply curve c(q). Concurrently, with a greater quantity of apples around, the demand price declines from p0 to p1. However, at quantity q1, p1 > c1 still, so newcomers will continue to enter the apple business, increasing quantity further. The process continues until the equilibrium quantity is reached, q*, at which point demand price and supply price converge to p*. The Marshallian dynamics of Figure 4 should be compared with the Walrasian process depicted in Figure 2.

- Marshallian DynamicsFig. 4
The mathematics of the Marshallian adjustment process have received nowhere near as much attention as the Walrasian (albeit, see Sonnenschein (1981, 1982), Svensson (1984) and Novshek and Sonnenschein (1986)). However, insofar as the single-market case is concerned, the formalities are simple. Defining the Marshallian demand and supply curves as:
p(q) = a 0 + a q
c(q) = b 0 + b q
where a < 0 and b > 0, naturally. Equilibrium quantity q* is defined as when p(q*) = c(q*), or solving:
q* = (a 0 - b 0)/(b - a)
Note, again, that as b - a > 0 by assumption, then for q* to be positive, we must have a 0 > b 0 (i.e. vertical demand curve intercept must exceed the vertical supply curve intercept). Now, defining Marshall's Law of Excess Profitability as a differential equation:
dq/dt = k[p(q) - c(q)]
where k > 0 is a "speed of adjustment" parameter. Plugging in our equations for demand and supply, we obtain:
dq/dt + k(b -a )q = k(a 0 - b 0)
a first order linear differential equation. The particular integral is the equilibrium quantity, q*. The complementary function is simply (q* - q(0))e-k(b -a )t where q(0) is the initial quantity. The solution to this system is::
q(t) = (q* - q(0))e-k(b -a )t + q*
The system is stable if q(t) ® q* as t® ¥ . A necessary and sufficient condition for this to be true is that -k(b - a)t < 0, which implies that it must be that b > a . As we have assumed a < 0, then this holds automatically.